Hoisting the Flag (Blog Post)
Every morning, during summer camp, the youngest boy scout has to hoist a flag to the top of a flag pole.
Every morning, during summer camp, the youngest boy scout has to hoist a flag to the top of a flag pole.
- Explain in words what each of the graphs above would mean.
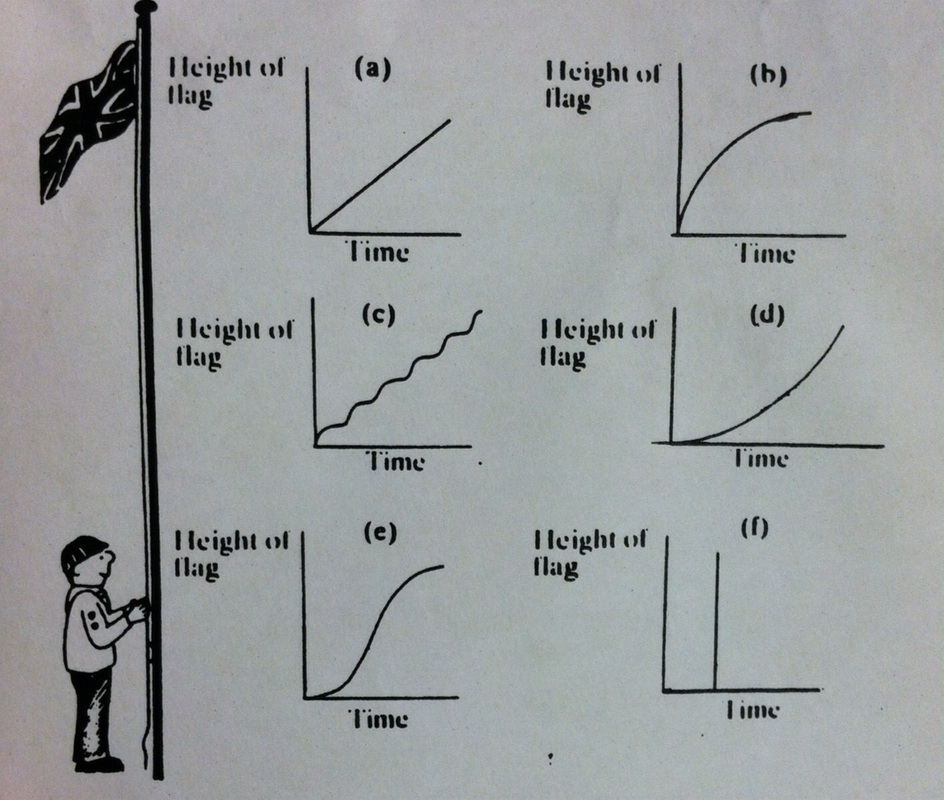
- Graph (a) indicates that the height of the flag would be affected because it would be hoisted at a 'constant rate'. Graph (b) indicates that the flag would be hoisted at a quicker rate but gradually become slower. Graph (c) indicates that the flag would be hoisted at a distinct yet reoccurring rate of height/time, because upon hoisting the flag, it would take a moment to get another grip around the rope to pull it up again. Graph (d), which is the opposite of Graph (b), indicates that the flag would be hoisted at a slower rate but gradually become faster. Graph (e), is the combination of Graphs (b) & (d), which indicates that the flag would be hoisted at a quicker rate then gradually become slower and then become hoisted at a slower rate and gradually become faster. Graph (f) indicates that the flag would require no time to raise it to the specific height which is impossible.
- Which graph shows this situation most realistically? Explain.
- Personally, I believe that Graph (c) would be the most realistic because of the given definition; the flag would be hoisted at a distinct yet reoccurring rate of height/time, because upon hoisting the flag, it would take a moment to get another grip around the rope to pull it up again.
- Which graph is the least realistic? Explain.
- Graph (f) because it indicates that the flag would require no time to raise it to the specific height which is impossible. (That I know of.)
 RSS Feed