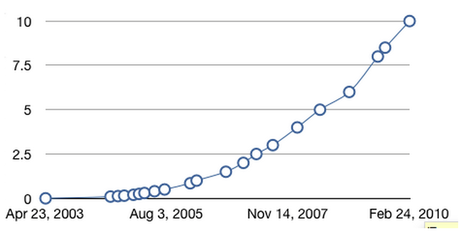
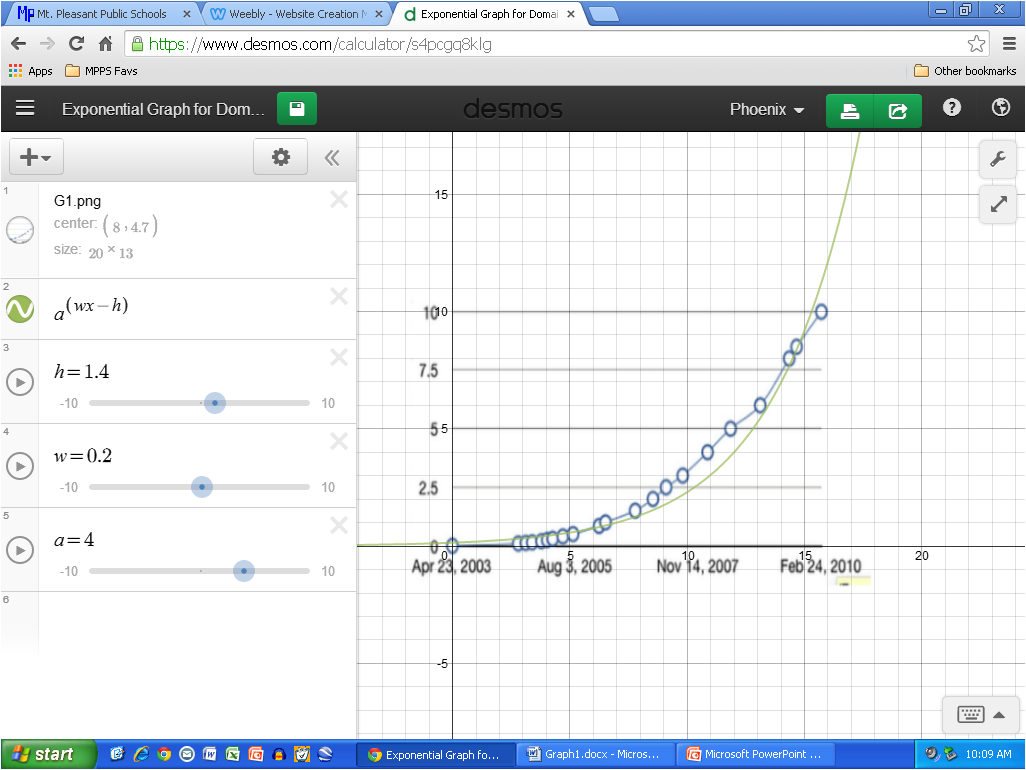
  | 1.) Observe and analyze the given graph to the left: What type of function does this data appear to follow? *The Data appears to follow that of an exponential function. Please enter some estimated points from the graph into Desmos.com or Geogbra.org to determine an estimated mathematical model for this function. Please include a screenshot of your model and an equation of your mathematical model for the estimated data points on your blog post. What is the domain of this function? *The Domain of my graph can equal all real numbers, but the function of the exponential growth can make x greater then or equal to 0. What is the range of this function? *The Range of my graph can equal all real numbers, but the function of the exponential growth is y is greater then or equal to 0. 2.) From an article on Apple itunes sales at: http://www.geek.com/apple/itunes-in-numbers-no-one-can-beat-the-superstore-1108472/ The graph is a classic example of exponential growth, but it has a human element involved after 2013. Please read the following article and comment on the future shape of your mathematical model: *The growth of the graph will continue to increase due to the human population, but will decrease in numbers because the only way it will continue to grow over time is if the continual growing population (y-axis), follows the years (x-axis). http://www.billboard.com/biz/articles/news/digital-and-mobile/5855162/digital-music-sales-decrease-for-first-time-in-2013 How does this affect your predictions of domain and range of the function? Is there a problem with trying to extend a set of data points to continuous functions? Why or why not? *Not in particular, simply because a graph should be an extension of Data Points to label a given model, but trying to extend some data points to continuous functions could fail to make it a function. |
0 Comments
Leave a Reply. | AuthorHey there fella, looks like you stumbled upon my page here... I'm just messin' with ya, I am Phoenix Slater-Snowden and you can find me on Twitter @x_PH03N1X_x and Facebook. ArchivesFebruary 2015 Categories |
 RSS Feed