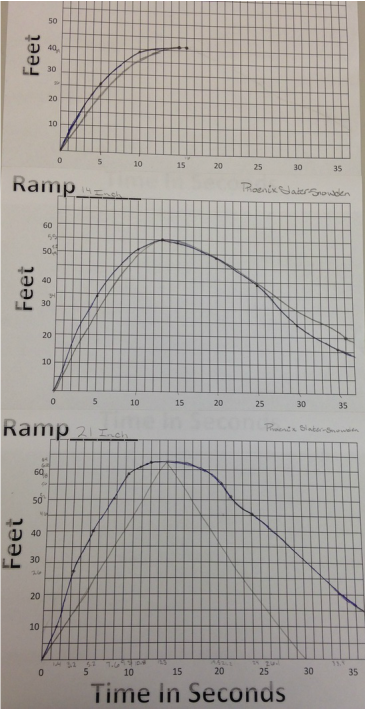
 | Blog Post For your blog post, please answer the following questions A. How close was your prediction to the actual graph? If you're graphs were different then why were they different? What initial reasoning led you to your original graph and why was it different? B. What do the zeros of your graph represent? C. How do the three graphs compare in terms of zeros, maximums and minimums? What's similar and different and why? D. Consider the slopes of the graphs. When is the graph rising the fastest and what does it mean? When is it falling the fastest and what does it mean? E. Please be sure to add an image of your graph(s) and contextualize the blog post for your readers. The '21 Inch Graph' prediction was my actual prediction of how the graph was going to rise and fall near the middle of the given time because I thought that because of the force displaced on the skateboard, it would have risen and fallen at a 'constant rate'. The Zeros of the graph show the beginning to the graph or drop of the skateboard from the ramp and in my '21 Inch Graph' prediction the end result had the skateboard arrived to the same destination where it started in 30 seconds time. The actual graphs that are colored blue in pen have the same zeros (starting point), relatively the same maximums in a given time and amount of feet covered, and the '21 Inch & 14 Inch Graph' have relatively the same minimums, whereas the '7 Inch Graph' stops at the 15 second mark. The graphs are rising the fastest in the beginning because the drop causes it to speed up, and the slope begins to drop at 15 seconds because the skateboard made a stop and go backwards. |
0 Comments
Leave a Reply. | AuthorHey there fella, looks like you stumbled upon my page here... I'm just messin' with ya, I am Phoenix Slater-Snowden and you can find me on Twitter @x_PH03N1X_x and Facebook. ArchivesFebruary 2015 Categories |
 RSS Feed